01
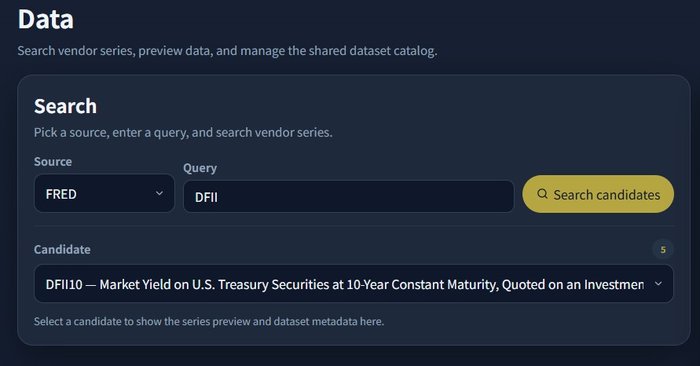
Import market data
Bring market and security data into a structure that is ready for analysis.
FactDecode connects market data, factor engineering, AI-driven search, and validation results in one research workspace. Move from intuition to evidence-backed analysis before you rely on a signal.
Product Preview
See the assumptions, drivers, SHAP, validation bands, and signal history behind each result.
Decide what deserves deeper research.
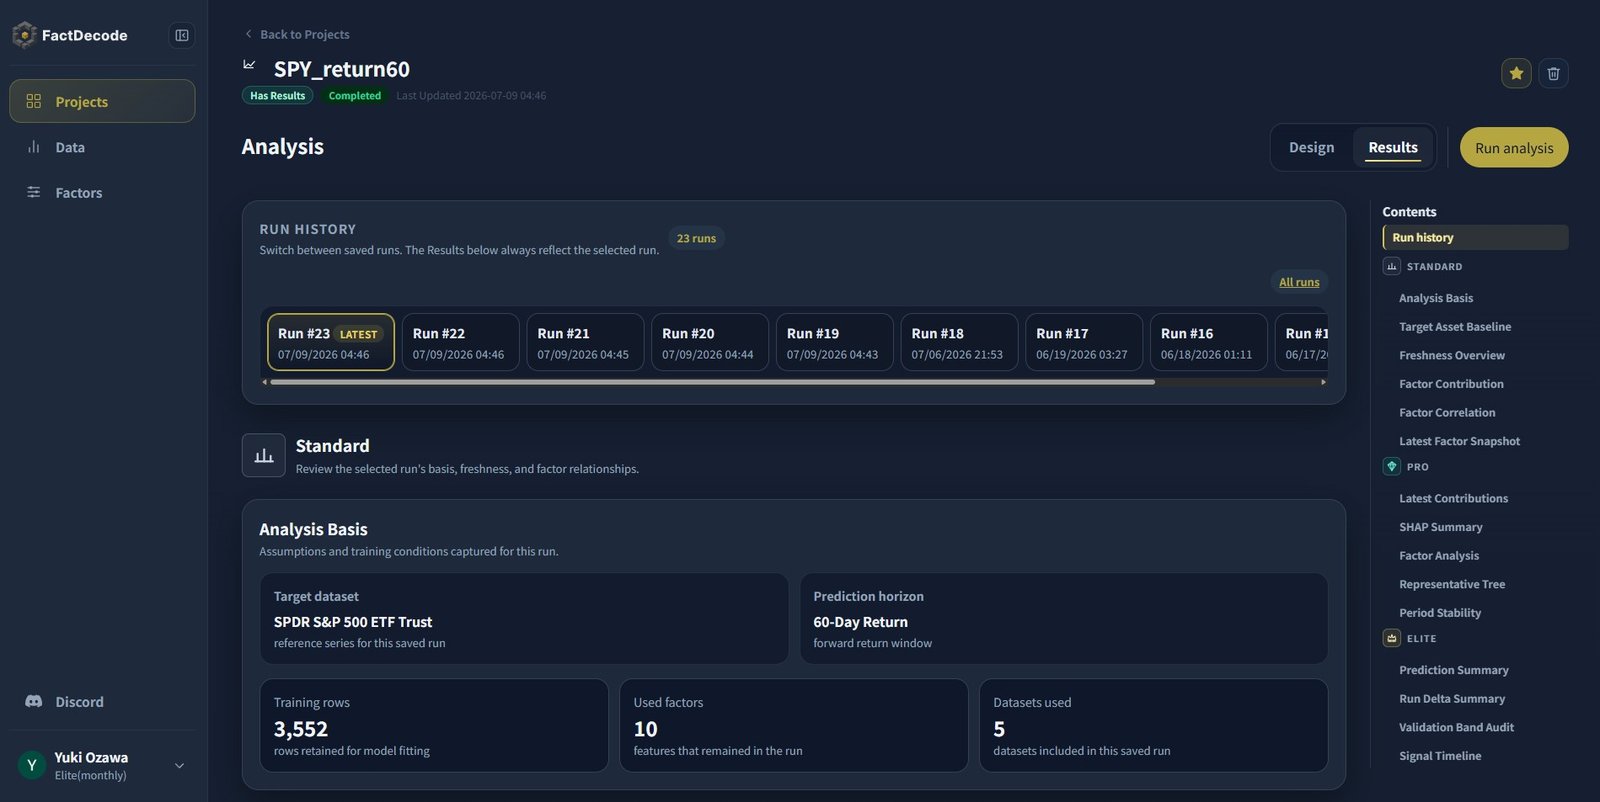
Review factor contribution, SHAP, validation results, and signal history in a single Results workspace.
Workflow
Collect data, build factors, define conditions, and compare runs in one connected workflow.
Move from idea to validation without juggling notebooks and screenshots.
01
Bring market and security data into a structure that is ready for analysis.
02
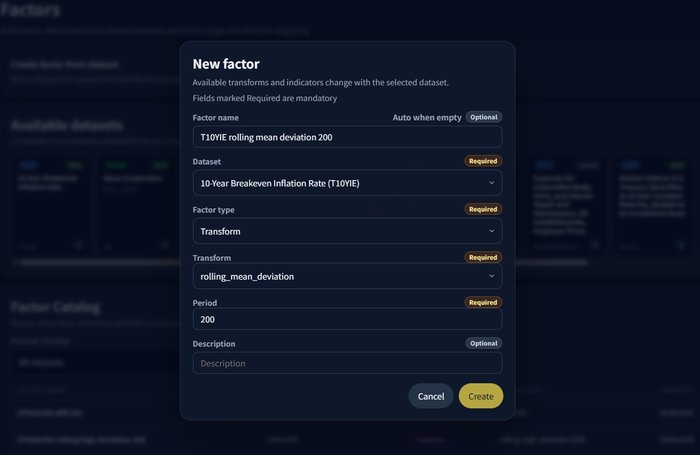
Create research factors from price, volume, relative strength, technical indicators, and other inputs.
03
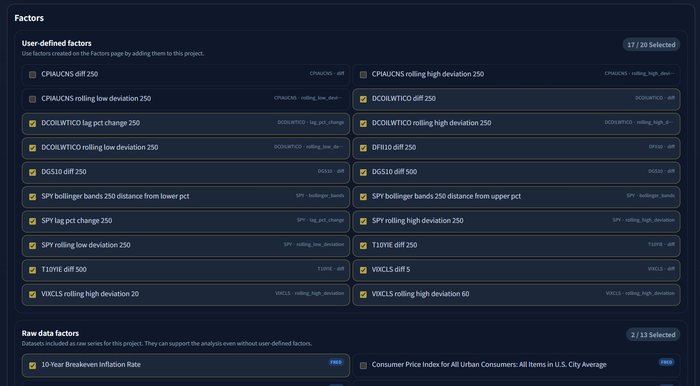
Use AI-driven exploration to test how multiple factors work together under defined conditions.
04
Inspect contribution, correlation, SHAP, validation bands, and score-bucket performance before relying on a result.
Analysis Dashboard
See factor impact, SHAP, validation bands, and run comparisons in one view.
Audit the evidence before trusting a score.
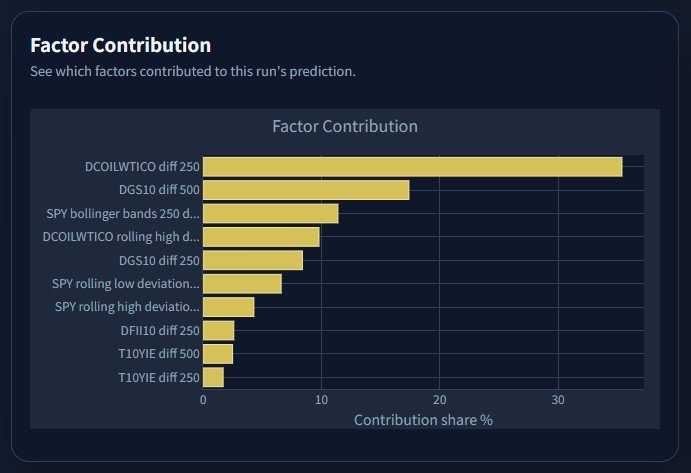
Factor
Identify which factors had the largest impact on the current result. Understand the structure behind the output instead of treating it as a black box.
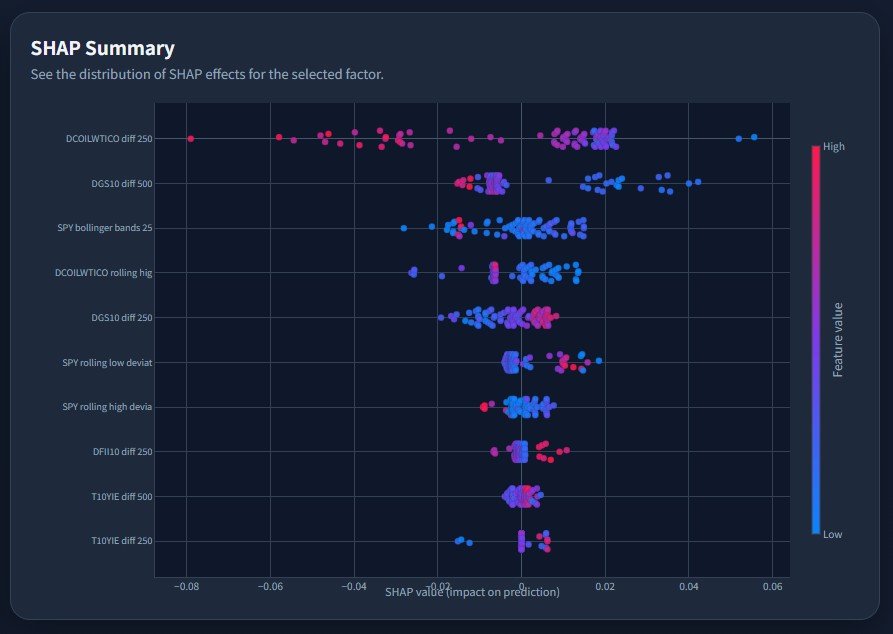
SHAP
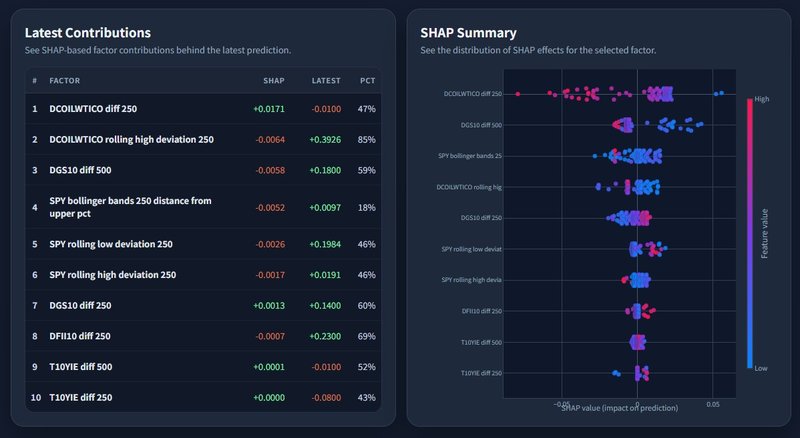
Review how each factor influenced the model across the distribution. See both direction and strength of impact.
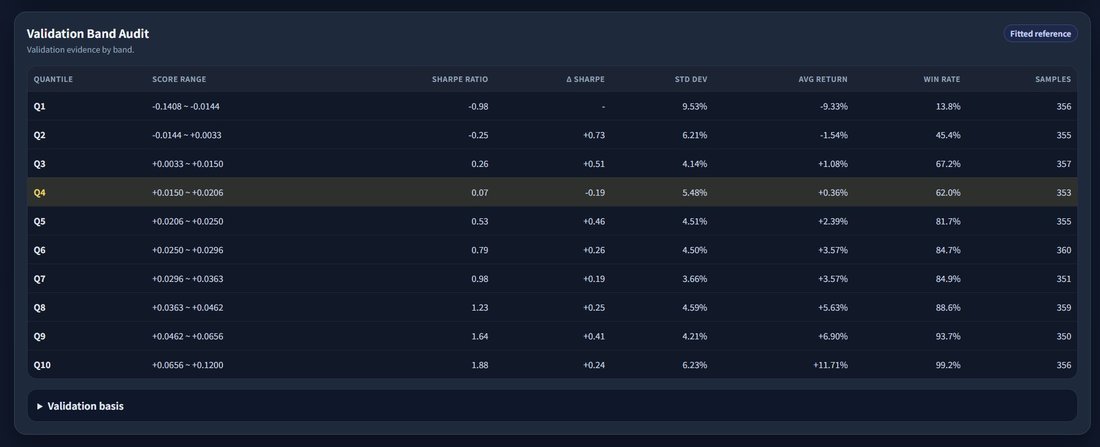
Validation
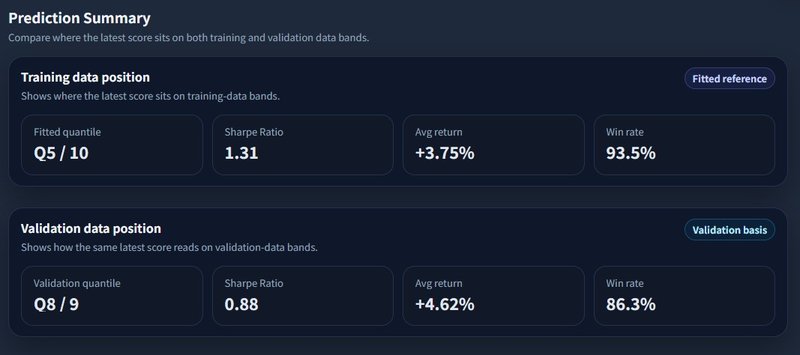
Compare performance across score buckets to check whether higher scores actually corresponded to stronger outcomes.
Evidence
Review correlations, quantile behavior, and SHAP patterns before trusting a signal.
Use multiple evidence layers to decide what deserves deeper research.

Correlation
Forward-return relationship
Review how each factor relates to future performance over the selected horizon. Use simple statistical evidence to understand which conditions were connected to the result.
Use correlation analysis to examine factor relationships with future returns.
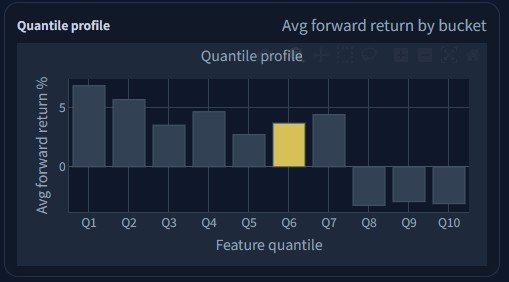
Quantiles
Factor bucket validation
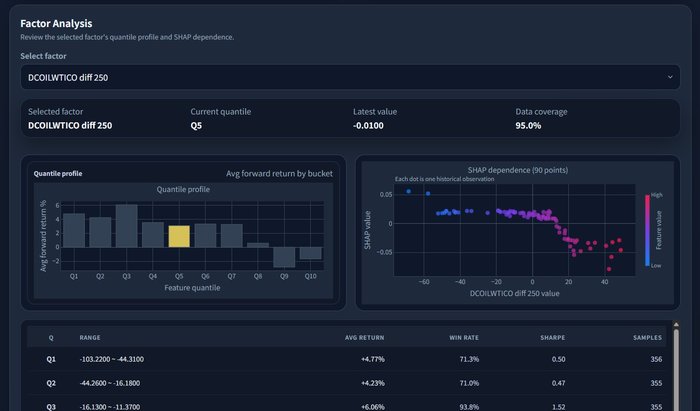
Split factor values into quantiles and compare average return, win rate, and other metrics across buckets. Check whether higher or lower factor values actually behaved differently.
Use quantile profiles to inspect realized differences across factor ranges.
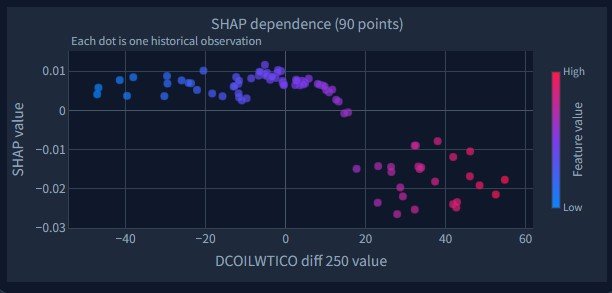
SHAP
Value-level effect
Review how specific factor levels influenced predictions. Identify ranges that pushed results higher or lower.
Use SHAP dependence views to inspect factor-level behavior.
Plan Value
Start with core results, then go deeper into drivers, validation, and run comparison.
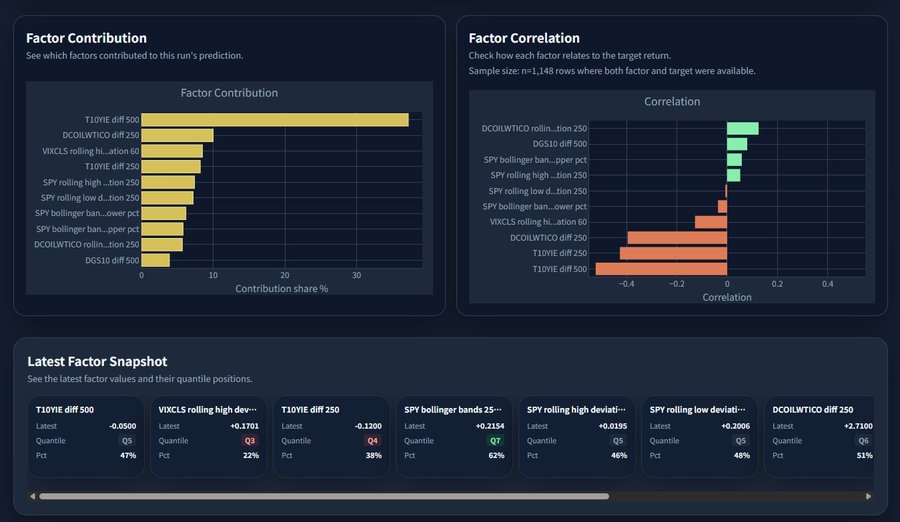
Use Standard to review the big picture: data, analysis results, factor contribution, and saved research history. It is for users who want to organize AI search output into research material they can inspect.
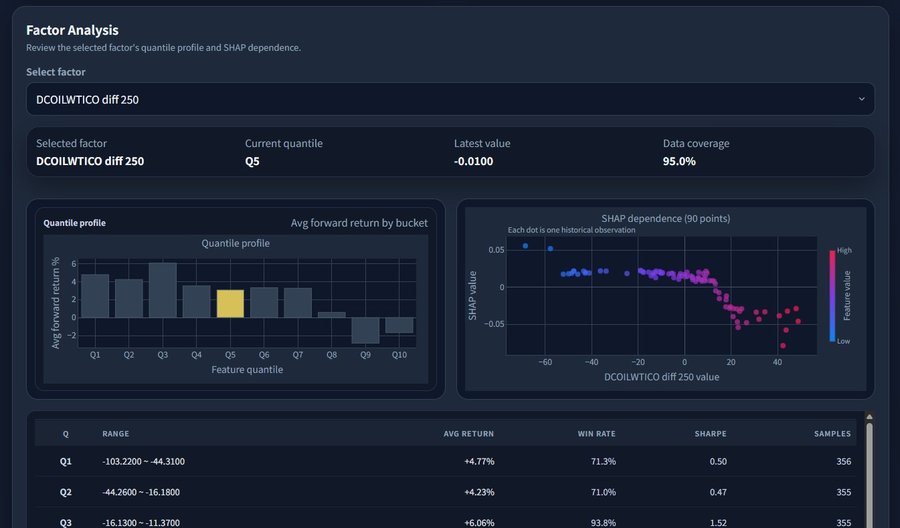
Use Pro to examine why a result appeared. Factor quantiles and SHAP analysis help you inspect model behavior, contribution patterns, and research validity beyond a surface-level score.
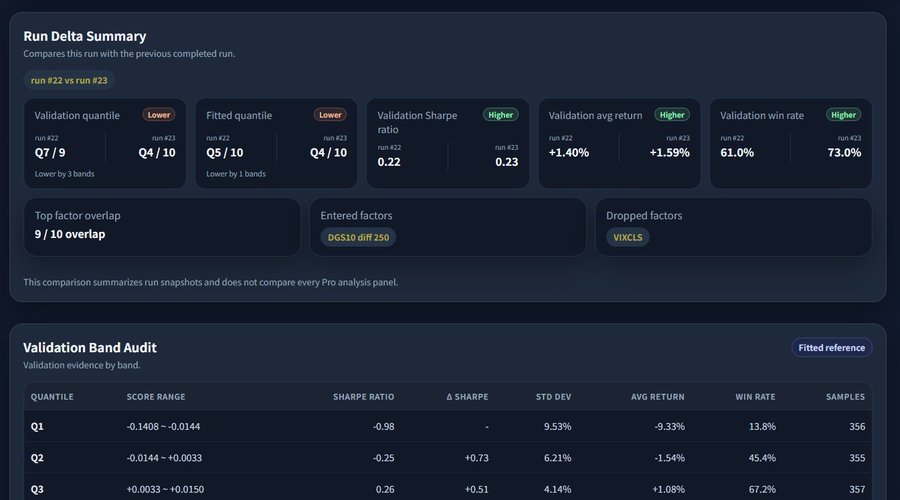
Use Elite when you need ongoing validation, latest-data summaries, run comparisons, and signal timelines. It is for users who want to monitor how research results change over time.
Use Cases
FactDecode can support multi-asset research, hypothesis testing, factor analysis, and run comparison across different markets and time horizons.
Multi-asset investors
When you follow equities, indexes, rates, commodities, or macro indicators, research evidence can become scattered across tools, screenshots, and notebooks.
FactDecode lets you organize Projects by asset class or time horizon and review summaries, validation results, and run history in one workspace.
Cross-asset research organization

Hypothesis-driven traders
A market setup may look interesting, but it is hard to know whether one condition mattered on its own or only in combination with other factors.
FactDecode helps you review AI-discovered conditions, factor contribution, and representative model structures so you can understand the research logic behind a result.
Condition-level interpretation
Factor researchers
Relative strength, volume, technical indicators, and macro variables can all look useful, but it takes time to test when and how they matter.
FactDecode combines factor contribution, quantile validation, and SHAP views to inspect importance, direction, and value-level behavior.
Factor behavior validation

Founder / Quant Trader / AI & Application Engineer
FactDecode came from a problem I kept running into as both a trader and a developer: ideas are easy to collect, but evidence is hard to organize.
Markets produce endless narratives, indicators, and opinions. What matters is not whether an idea sounds convincing, but whether it can be tested under clear conditions and reviewed with enough context.
FactDecode is the research environment I wanted for myself: a workspace that connects market data, factor creation, AI search, and evidence review through contribution, SHAP, quantile validation, and run comparison.
The goal is not to tell users what to buy or sell. The goal is to help users test their own hypotheses and organize research evidence before making their own decisions.
Organize your validation results and move to the next research step.
Have a referral code? Apply it in the pricing section to preview discounted pricing.
Choose the level of research depth you need.
If you have a referral code, apply it to preview eligible discounted pricing.
$79/mo
Start building your research workflow.
$249/mo
Go beyond the score and inspect why the result appeared.
$799/mo
Keep research updated with latest data and run comparisons.
Apply your code to update eligible plan pricing before you choose a plan.
Enter a referral code before selecting a plan.
No. FactDecode is a research and analytics workspace. It does not recommend specific securities, tell users to buy, sell, or hold, manage assets, or provide personalized financial advice. Historical and validation results do not guarantee future performance. Users are responsible for their own investment decisions.
Data sources may vary by plan and analysis target. FactDecode organizes market data, security data, macroeconomic data, and derived factors into a format that can be used for research and validation. Public economic data such as FRED may be used where applicable.
FactDecode is designed for one active session per license. If you log in from a new device, the previous session may be invalidated. This helps protect account sharing and keeps each research workspace tied to its licensed user.
Yes. You can cancel or change your plan from the application settings. After cancellation, billing stops from the next renewal period.
If payment cannot be confirmed, paid features such as data access and result viewing may be temporarily restricted. Your saved research data is not immediately deleted. Access can be restored after successful payment, subject to the service terms.