FactDecode: Evaluate Factor Selection with Model Performance and Run Comparisons
Published on October 22, 2026

FactDecode now brings factor screening, Nested OOS model performance, and score-band analysis together in Results. Compare saved Runs to examine how changes to your factor selection affect model evaluation.
More factors do not necessarily make a better model.
Interest rates, inflation, stock prices, exchange rates, and technical indicators can all provide useful information. But when there are many possible factors, deciding which ones to use—and whether they actually help—is not straightforward.
We have significantly upgraded FactDecode's Results.
You can now examine the factor selection process, model performance, historical out-of-sample (OOS) evaluation, and score-band outcomes in greater detail.
By comparing saved Runs with different factor selections, you can also investigate how adding, changing, or removing factors affects the model's evaluation results.
See Which Factors Were Selected—and Why
FactDecode allows you to select factors for a model from a larger set of candidates.
With this upgrade, Results makes the selection process easier to examine.
The factor screening results show which candidates were evaluated and which were ultimately selected for the final model.
Screening importance is also presented separately from factor contributions in the final model.
A factor that appears important during screening is not necessarily selected for the final model.
By making these distinctions visible, FactDecode provides more evidence for deciding which factors to keep and which ones may be worth reconsidering.

Evaluate Model Performance on Historical Out-of-Sample Data
After selecting factors, the next question is how much confidence to place in the resulting model.
Strong results on training data do not necessarily mean that similar performance will hold on unseen data.
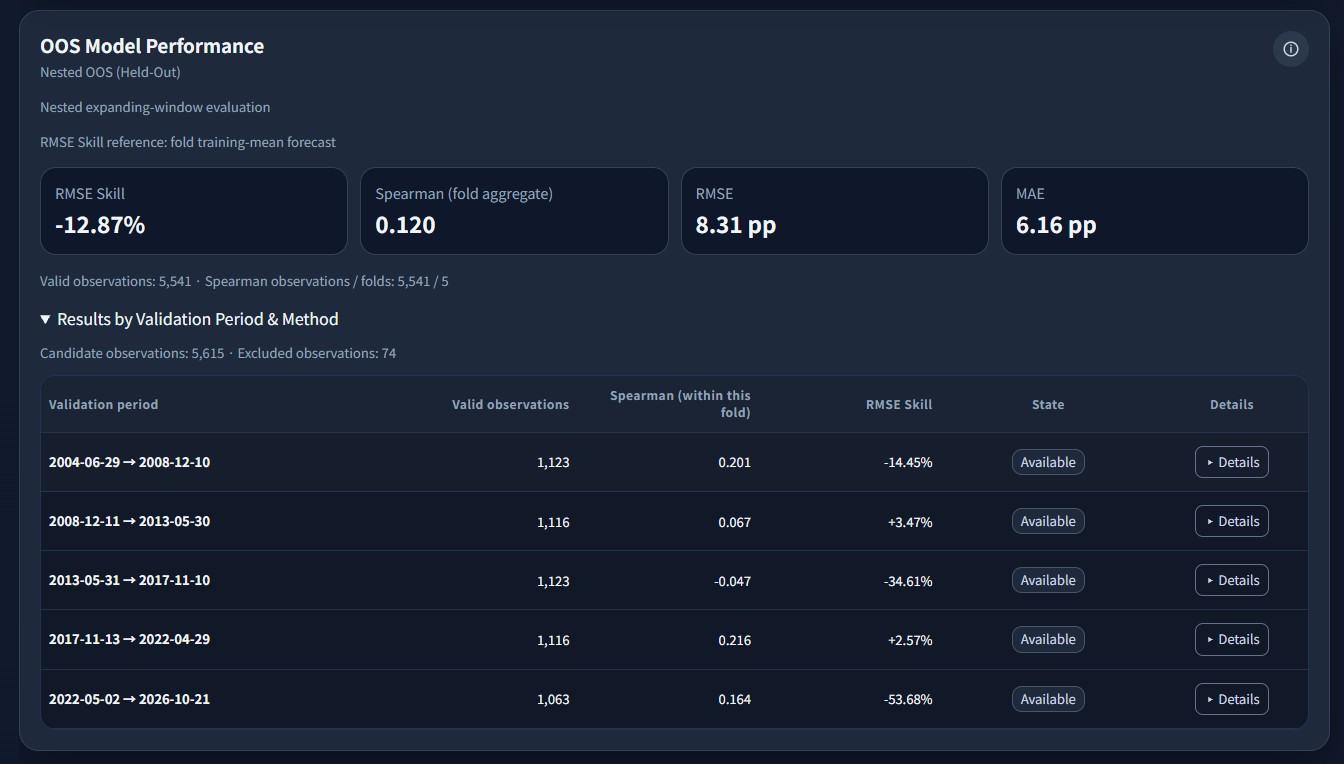
The new OOS Model Performance section evaluates the model-selection and training process using historical periods held out from the corresponding training steps.
Key evaluation metrics include:
- RMSE and MAE: Measures of the difference between predicted and realized returns.
- RMSE Skill: How prediction error compares with a simple benchmark forecast.
- Spearman: How closely the rankings of predicted returns correspond to the rankings of realized returns.
You can also examine results for individual validation periods.
This makes it easier to investigate performance differences across periods, including cases where prediction accuracy or ranking quality deteriorated.
Rather than relying only on an overall performance metric, you can examine where the model performed well and where its results were weaker.
How Do Changes to Factors Affect Model Performance?
This upgrade also makes comparisons between saved Runs more informative.
Suppose you remove one factor from the candidate set.
How does that change affect prediction accuracy? Does the model's ability to rank future returns improve or deteriorate?
The new evaluation metrics help you examine these differences more concretely.
Real Analysis Example: Comparing Gold Models Before and After Removing One Factor
In an actual gold-market analysis, we compared two saved Runs before and after removing one candidate factor.
The prediction target was the return 60 observations ahead.
Both Runs covered the same historical OOS evaluation period, with five validation folds and 5,882 valid observations.

After removing the factor, both RMSE Skill and Spearman declined.
Looking at the fold-level results also revealed which validation periods contributed most to the difference.
Under these particular analysis conditions, the comparison provides evidence worth considering in favor of retaining the original candidate-factor configuration.
However, RMSE Skill was negative in both Runs.
This means that, in the evaluated OOS results, neither configuration achieved a lower RMSE than the benchmark forecast.
Changing the candidate-factor set can also affect which factors are ultimately selected and which training observations are available.
Therefore, this comparison does not establish the independent causal effect of a single factor or guarantee future predictive performance.
Nevertheless, comparing the two Runs provides valuable evidence for deciding which factors to retain and what to investigate next.
This example uses existing saved Run results. The upgrade does not introduce an automatic factor-ablation tool or a new trading-performance calculation.
Explore Score-Band Outcomes to Better Understand the Model
Prediction errors and ranking correlations are important, but they are not the only ways to evaluate a model.
Another useful perspective is to examine what historically happened when the model assigned different prediction scores.
Model Score Band Analysis groups prediction scores into ten bands, from Q1 to Q10.
For each band, you can examine metrics such as average realized returns, the percentage of positive returns, and the number of observations.
The upgrade makes an important distinction between two types of results.
Fitted Reference (In-Sample)
This section shows how the currently fitted model separates observations within its training data.
It provides a reference for understanding the score bands learned by the model.
Historical Nested OOS Score Bands
This section examines score-band outcomes in historical held-out periods.
For each validation period, the model and score-band boundaries are determined using the corresponding historical training data, and the outcomes are evaluated on observations that were not used in that training step.
You can also explore return variability within each band, differences from the unfiltered average in the same validation fold, and results across individual validation periods.
A pattern that looks strong in fitted data may not remain consistent out of sample.
By examining the two views separately, you can investigate the model's behavior from multiple perspectives rather than relying on a single attractive result.
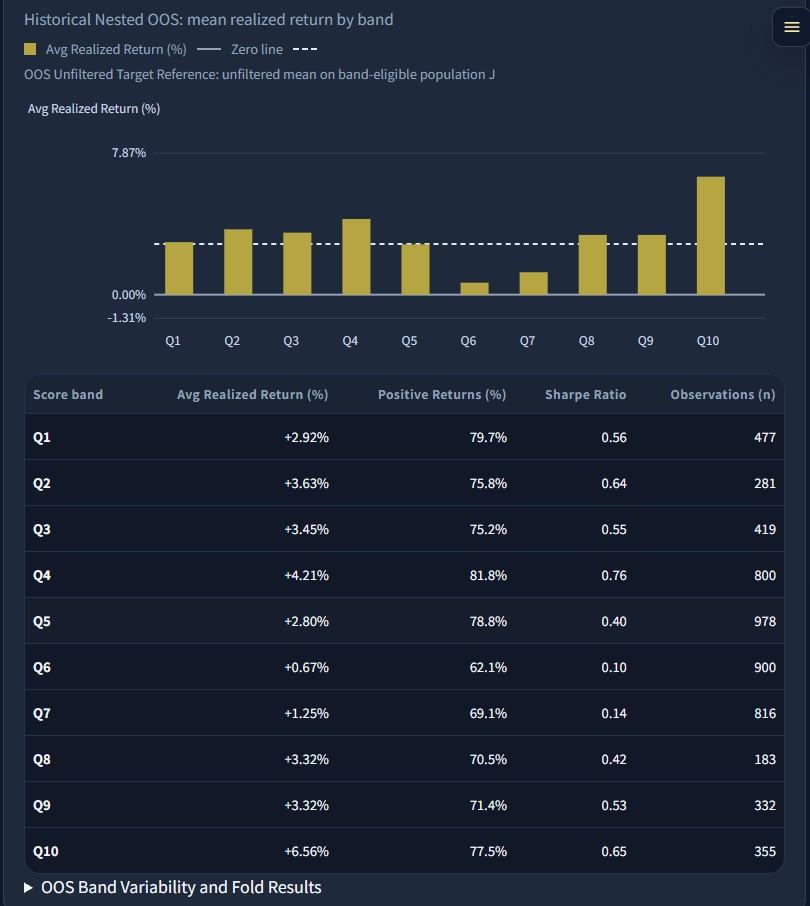
Score-band outcomes are summaries of historical observations. They do not guarantee future returns or represent the performance of an executed trading strategy.
Clearer Results Throughout
Alongside the analytical improvements, we have refined the presentation of Results.
Table backgrounds, borders, spacing, and headers now follow a more consistent design. Selection and validation states are also easier to distinguish.
Detailed information remains available through expandable sections, allowing you to review key figures first and explore supporting evidence when needed.
We have also improved the stability of Run navigation and history handling when switching between saved analysis results.
Existing saved Runs retain their original results. Newly introduced evaluation metrics are available when the corresponding analysis data has been saved.
Feature availability varies by plan. Detailed Nested OOS model performance evaluation and score-band analysis are available with FactDecode Elite.
Choose Factors Based on Evidence
The goal is not simply to build a more complex model or use more factors.
The important questions are:
Which factors should you use?
Which ones deserve a closer look?
And what evidence supports those choices?
With this upgrade, FactDecode offers a more comprehensive research environment for evaluating factor selection and understanding model performance.
Try analyzing the factors you are interested in, then explore the selection results and model evaluation.
By saving and comparing Runs with different factor configurations, you may uncover insights that help guide your next analysis.