Do Higher Japanese Bond Yields Strengthen the Yen? Testing Japan’s 10-Year Yield and USD/JPY
Published on September 19, 2026

When Japanese Yields Rise, Should the Yen Strengthen?
When Japanese interest rates rise, the yen is often expected to strengthen. A common explanation is that higher Japanese yields narrow the yield gap between Japan and the United States, making the yen relatively more attractive.
It is an intuitive story, and an easy one to use when explaining market moves. But a plausible explanation is not necessarily a relationship that consistently appears in the data.
So what actually happens after Japan’s long-term yields rise? Does USD/JPY tend to fall, indicating a stronger yen?
To examine that question, we compared the 5-trading-day change in Japan’s 10-year government bond yield with the USD/JPY return over the following five trading days.
What Happened to USD/JPY After Japan’s 10-Year Yield Moved?
This analysis focuses on changes in Japan’s 10-year yield rather than the yield level itself. Historical observations were divided into 10 groups, from the largest 5-day yield declines to the largest increases.
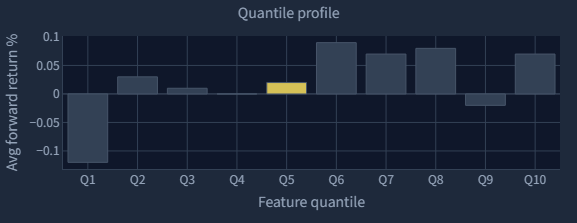
Q1 represents the largest declines in Japanese yields, while Q10 represents the largest increases. For each group, we calculated the average USD/JPY return over the following five trading days.
A positive USD/JPY return means the dollar strengthened and the yen weakened. A negative return means the dollar weakened and the yen strengthened.
If larger increases in Japanese yields were consistently followed by lower USD/JPY, we would expect returns to become increasingly negative toward the higher-yield-change groups. If the results move back and forth between positive and negative returns, however, the simple “higher Japanese yields = stronger yen” explanation becomes harder to support.
The Results Were Not as Simple as “Higher Yields = Stronger Yen”
The results did not show a clear pattern in which larger increases in Japanese yields were followed by a stronger yen.
In Q1, which contained the largest declines in Japan’s 10-year yield, the average USD/JPY return over the following five trading days was -0.12%. In other words, even after Japanese yields fell sharply, USD/JPY moved lower on average.
Meanwhile, Q6, Q7 and Q8 — representing small to moderate increases in Japanese yields — produced average USD/JPY returns of +0.09%, +0.07% and +0.08%, respectively. Even Q10, which contained the largest increases in Japanese yields, showed an average return of +0.07%.
In this dataset, we therefore did not find a clear relationship in which larger increases in Japan’s 10-year yield were followed by a stronger yen.
That does not mean Japanese yields do not matter for USD/JPY. The narrower conclusion is that the 5-day change in Japan’s 10-year yield alone did not provide a simple explanation for USD/JPY over the following five trading days.
U.S. 10-Year Yield Changes Showed a Clearer Direction
We then ran the same comparison using the U.S. 10-year Treasury yield.
As with the Japanese yield, historical observations were divided into 10 groups based on the previous five trading days of yield movement. We then compared those groups with the average USD/JPY return over the following five trading days.
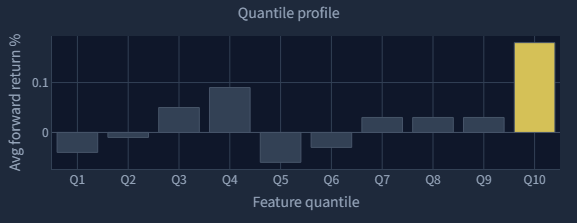
The relationship was not perfectly consistent here either. But compared with the Japanese yield results, the direction was easier to see.
In Q1, which represented the largest declines in U.S. 10-year yields, the average 5-day USD/JPY return was -0.04%. At the opposite extreme, Q10 — the largest increases in U.S. yields — showed an average return of +0.18%.
Within this analysis, changes in the U.S. 10-year yield showed a clearer directional relationship with USD/JPY than changes in Japan’s 10-year yield did.
That still does not establish causality. The result shows a relationship within this analysis; it does not prove that changes in U.S. Treasury yields caused the subsequent moves in USD/JPY.
Japan’s 5-Day Yield Change Was Not a Leading Model Factor
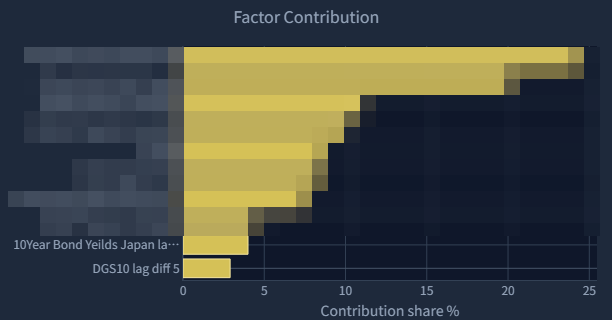
So far, we have looked at Japan’s 10-year yield change as a single factor and compared it with subsequent USD/JPY returns.
FactDecode also allows us to look at the question from another angle. Within a model that uses multiple factors, we can examine how much each factor contributed to the model’s output.
In this analysis, the 5-day change in Japan’s 10-year yield was not among the model’s leading factors.
This does not mean Japanese yields are unimportant. It refers specifically to the 5-day change examined in this article. Factor contribution can also change depending on the set of factors used, the analysis period and the model itself.
What matters here is that two different views pointed in a similar direction. The single-factor comparison did not show a simple “higher Japanese yields = stronger yen” pattern, while the 5-day change in Japan’s 10-year yield was also not a dominant factor in the multi-factor model.
Together, those results suggest that the recent change in Japanese yields alone is too simple an explanation for short-term USD/JPY moves.
Why Looking at Japanese Yields Alone Can Be Misleading
The result does not reject the idea that Japanese yields matter for the yen. What it challenges is the temptation to reduce short-term USD/JPY moves to a single explanation:
Japanese yields rose, therefore the yen should strengthen.
In the historical observations examined here, rising Japanese yields were not consistently followed by a lower USD/JPY rate. And when Japanese and U.S. 10-year yield changes were compared, the U.S. side showed a clearer directional relationship with USD/JPY.
That suggests a broader lesson when interpreting currency markets. It is not enough to notice that “rates went up.” We also need to ask which country’s rates moved, whether we are looking at the level or the change, over what time horizon the move occurred, and what happened to the currency afterward.
Once those questions are separated, the apparently simple relationship between interest rates and USD/JPY becomes much less simple.
What About the U.S.-Japan Yield Spread?
That leads naturally to another question.
If Japanese yields alone do not provide a simple explanation, what happens when we look at the yield difference between Japan and the United States?
The U.S.-Japan yield spread is frequently used to explain movements in USD/JPY. But the yield spread itself was not the subject of this analysis. Here, the 5-day change in Japan’s 10-year yield was the primary factor, while the 5-day change in the U.S. 10-year Treasury yield was used as a comparison.
What we can say from this analysis is that a single-factor explanation based only on rising Japanese yields was not enough to describe short-term USD/JPY behavior clearly.
Whether the U.S.-Japan yield spread provides a clearer and more consistent relationship is a separate question — and one worth testing next.
A rise in Japanese long-term yields did not automatically translate into a stronger yen over the following five trading days. In this analysis, the 5-day change in Japan’s 10-year yield showed no clear one-directional relationship with subsequent USD/JPY returns, while changes in U.S. 10-year yields showed a more visible directional pattern.
Market narratives are often more useful when treated as hypotheses rather than conclusions. Instead of adding another plausible explanation after the market moves, the more useful process is to test those explanations and remove the ones that are too simple to fit the data.
Don’t Stop at Reading the Analysis
FactDecode lets you test market hypotheses using multiple factors and examine both historical relationships and factor contribution within a model.