Do Higher U.S. 10-Year Treasury Yields Mean Lower S&P 500 Returns?
Published on September 2, 2026

Why Do High U.S. 10-Year Treasury Yields Worry Equity Investors?
Long-term Treasury yields matter to equity investors because they affect valuations and financing conditions. That makes the intuition that “higher yields are bad for stocks” easy to understand.
But there are two different questions to consider. One is whether the 10-year Treasury yield is high. The other is whether it has risen sharply over a short period. A yield reached gradually over several months may not represent the same market environment as the same yield reached after a rapid increase over just a few days.
In this analysis, we separate those two dimensions and examine how the absolute level and recent change in the U.S. 10-year Treasury yield have historically related to the S&P 500’s 5-trading-day forward return.
How We Tested the U.S. 10-Year Treasury Yield Against the S&P 500
The target variable in this analysis is the S&P 500’s 5-trading-day forward return. For each observation date, we examine how the index performed over the following five trading days. The main factor is the U.S. 10-year Treasury yield, using the FRED series DGS10.
Looking at the S&P 500’s 5-Trading-Day Forward Return
This analysis is not a forecast of where the 10-year Treasury yield itself will go next. Instead, we examine how the S&P 500 performed over the following five trading days when the Treasury yield was in a particular state at the starting point.
In other words, the question is: when the 10-year Treasury yield was in a particular state, how did the S&P 500 perform over the next five trading days?
Separating the Yield “Level” From Its 5-Day Change
We examine DGS10 in two ways. The first is the absolute level of the 10-year Treasury yield. The second is how much the yield has changed compared with five trading days earlier.
These represent different information. A given yield level and a move to that same level after a large increase over the previous five trading days do not necessarily describe the same market environment.
By separating the two, we can test whether high yields themselves are associated with weaker equity returns and whether short-term changes in yields show a different relationship.

Do Higher 10-Year Treasury Yields Mean Lower S&P 500 Returns?
We first examine the absolute level of the U.S. 10-year Treasury yield. If the simple narrative that “higher yields are worse for stocks” held consistently, we would expect the S&P 500’s forward returns to deteriorate progressively as Treasury yield quantiles increase.
That is not what the results show.
When the yield level is divided into quantiles, higher-yield environments do not produce a clear, one-directional decline in the S&P 500’s 5-trading-day forward return. Lower-yield quantiles are not uniformly stronger, and higher-yield quantiles are not uniformly weaker.
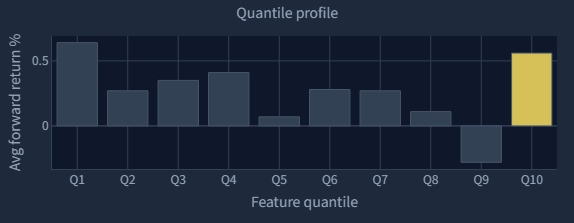
The key takeaway is that a high U.S. 10-year Treasury yield by itself appears to be a weak basis for making a short-term bearish call on the S&P 500.
The historical data does not support a simple rule in which progressively higher Treasury yields consistently translate into progressively weaker forward equity returns.
A Specific Yield Level Is Not a Validated Sell Threshold
At the time of this analysis, 4.75% was a notable market level. But this analysis did not identify 4.75% by searching historical data for a threshold at which S&P 500 performance changes materially.
That distinction matters.
The results do not support treating 4.75% as a boundary where yields below it are “safe” and yields above it are “dangerous.” The fact that the 10-year Treasury yield was above 4.75% at the time of the analysis is different from showing that 4.75% is a statistically validated sell signal.
In this dataset, there is no clear evidence that 4.75% itself represents a structural turning point for the S&P 500.
What Happens When the 10-Year Treasury Yield Rises Quickly?
The absolute yield level does not show a simple relationship with forward equity performance. The next question is whether the recent move in yields shows a different pattern.
To examine this, we compare DGS10 with its level five trading days earlier and then measure the S&P 500’s return over the following five trading days.
The results are somewhat different from those based on the absolute yield level. In some of the quantiles where Treasury yields had risen more substantially over the previous five trading days, subsequent S&P 500 returns were weaker.

This suggests that it may be useful to consider not only where the 10-year yield is, but also how it arrived there.
The same yield level reached gradually and reached after a sharp short-term repricing do not necessarily represent the same market state.
Short-Term Yield Changes Show Differences, but Not a Strong Standalone Signal
The differences across the short-term yield-change quantiles should not be overstated. The results do not support a mechanical rule that the S&P 500 will fall whenever the 10-year Treasury yield rises sharply.
Differences in subsequent returns are visible across the DGS10 change quantiles, but the relationship is not consistent enough to treat short-term yield changes as a standalone trading signal.
The reverse conclusion is also unsupported. The absence of a sharp increase in Treasury yields does not imply that equities are necessarily safe.
A more defensible conclusion is that recent yield changes are worth examining alongside the absolute yield level, rather than treating either measure as a simple buy-or-sell rule.
The Level of Yields Is Not the Whole Story
One of the more useful findings from this analysis is that the picture changes once we separate the level of the 10-year Treasury yield from its recent change.
Market commentary often focuses on specific yield milestones. Those levels can attract attention, but the historical relationship with short-term S&P 500 performance does not suggest that higher absolute yields automatically lead to progressively weaker returns.
At the same time, some of the larger short-term increases in Treasury yields are associated with weaker subsequent S&P 500 performance.
This means that looking at both the current yield level and the path taken to reach it may be more useful than focusing on the level alone.
The historical data therefore provides little support for a simple rule such as “sell stocks because the 10-year Treasury yield is high.”
The U.S. 10-Year Treasury Yield Alone Cannot Explain Equity Returns
This analysis examines a historical relationship between the U.S. 10-year Treasury yield and short-term S&P 500 performance. It does not establish that changes in Treasury yields causally produce changes in equity prices.
Both Treasury yields and equities respond to a broader set of forces, including inflation expectations, Federal Reserve policy expectations, economic growth expectations, fiscal conditions and Treasury supply, oil prices, the U.S. dollar, risk sentiment, and investor positioning.
A simultaneous move in yields and stocks may therefore reflect common underlying drivers rather than a direct causal relationship between the two.
There is another important distinction as well. A nominal 10-year Treasury yield reflects several components, including real yields, inflation compensation, and term premia. The implications for equities may differ depending on what is driving the move in nominal yields.
That creates a natural follow-up research question: separating measures such as the 10-year real Treasury yield, including DFII10, from breakeven inflation measures and testing whether the source of the yield move changes its relationship with equity returns.
Conclusion: A High 10-Year Treasury Yield Is Not a Sell Signal by Itself
We examined the relationship between the U.S. 10-year Treasury yield and the S&P 500’s 5-trading-day forward return by separating the yield’s absolute level from its recent change.
For the absolute level, the data does not show a simple pattern in which progressively higher Treasury yields are consistently followed by weaker S&P 500 returns. That makes it difficult to justify treating a high 10-year Treasury yield—or any single yield level—as a standalone sell signal.
The picture becomes somewhat more interesting when we look at the change from five trading days earlier. Some of the quantiles with larger increases in Treasury yields show weaker subsequent S&P 500 performance. This suggests that recent yield movements may be worth considering in addition to the absolute level.
Even so, the relationship is not monotonic, and short-term yield changes are not consistent enough to support a simple mechanical trading rule.
The broader conclusion is therefore more nuanced: when evaluating the U.S. 10-year Treasury yield, it is more useful to distinguish between “how high it is” and “how quickly it has moved” than to treat a high yield as inherently bearish for equities.