Stronger Yen = Weaker Stocks, Weaker Yen = Stronger Stocks? Testing USD/JPY and the Nikkei 225
Published on September 9, 2026

Stronger Yen = Weaker Stocks, Weaker Yen = Stronger Stocks?
USD/JPY is hard to ignore when following Japanese equities. A weaker yen is often viewed as supportive for Japanese stocks, partly because of its potential impact on exporters’ earnings, while a stronger yen is commonly seen as a headwind.
But two different questions are often mixed together: whether USD/JPY and the Nikkei 225 move together on the same day, and whether a move in USD/JPY is related to how the Nikkei 225 performs afterward. Even if a relationship appears, there is another possibility to consider: perhaps USD/JPY only looks important because it happens to coincide with an already strong or weak trend in the Nikkei 225 itself.
In this analysis, we focus on USD/JPY lag pct change 1, which represents the currency pair’s change over one trading day, and compare it with subsequent Nikkei 225 performance.
The question is simple: after USD/JPY moves toward either a stronger or weaker yen, how does the Nikkei 225 tend to perform over the following five trading days?
This analysis does not assume that a stronger yen causes stocks to fall or that a weaker yen causes them to rise. We are testing what relationship appears in the historical data.
How We Tested the Relationship Between USD/JPY and the Nikkei 225
The target in this analysis is the Nikkei 225. For each observation date, we calculate the index’s return over the following five trading days and compare it with USD/JPY lag pct change 1 for that date.
Looking at the Nikkei 225’s 5-Trading-Day Forward Return
The primary horizon is five trading days. A one-day horizon can be heavily influenced by same-day news, sudden market moves, and other short-term noise. Extending the horizon to around 20 trading days introduces more intervening events, such as economic releases, monetary-policy developments, and corporate earnings, making the relationship with the starting USD/JPY move harder to interpret.
For that reason, the analysis focuses on the Nikkei 225’s 5-trading-day forward return.
Importantly, we are not simply asking whether USD/JPY and the Nikkei 225 moved in the same direction on the same day. We are asking what happened to the Nikkei 225 over the following five trading days after a one-day move in USD/JPY.
The Key Factor: USD/JPY’s 1-Day Change
The central factor in this article is USD/JPY lag pct change 1.
A more negative value means USD/JPY moved lower over the one-day period—that is, the yen strengthened against the U.S. dollar. A more positive value means USD/JPY moved higher, corresponding to a weaker yen.
The same USD/JPY level can represent very different market conditions depending on how it was reached. A level reached gradually over several weeks is not necessarily equivalent to the same level reached after a sharp one-day currency move. This article therefore focuses specifically on that short-term change.
We also test another possibility: could USD/JPY simply look important because the Nikkei 225 was already in a strong trend?
USD/JPY Still Contributed After Adding the Nikkei 225’s Own Market State
We first examine Factor Importance / Contribution.
A relationship between USD/JPY and subsequent Nikkei 225 returns would be less informative if USD/JPY were merely standing in for the Nikkei 225’s own trend. For example, if Japanese equities had already been in a strong long-term uptrend while the yen was weakening at the same time, the currency factor might appear important even though the index’s own market state was doing much of the explanatory work.
To examine this, we added factors describing the Nikkei 225’s own longer-term state, including its position relative to roughly 250 trading days earlier and its distance from 250-day highs and lows.
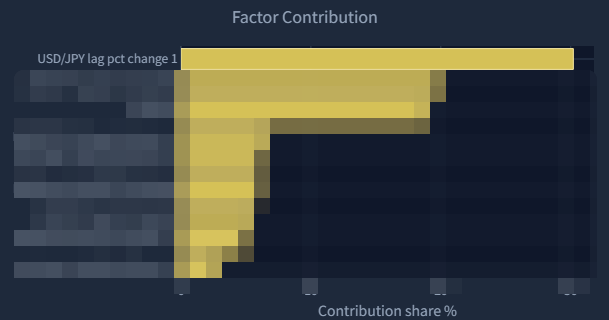
Could This Simply Reflect an Already-Strong Nikkei 225?
The results show that the contribution from USD/JPY lag pct change 1 remains after adding the Nikkei 225’s own longer-term trend and position relative to recent highs and lows.
At a minimum, that makes it harder to explain the result simply as: “The Nikkei 225 was already strong, and USD/JPY only appeared relevant because the two happened to move together.”
There is an important limit to this interpretation. Factor Importance / Contribution does not prove that USD/JPY lag pct change 1 can predict the Nikkei 225 on its own. Nor does it show that currency moves causally drive Japanese stock prices.
What we can say is narrower: information associated with USD/JPY’s 1-day change remains in the analysis even after factors describing the Nikkei 225’s own market state are included.
Is There a Correlation Between USD/JPY and the Nikkei 225?
“USD/JPY and Nikkei 225 correlation” is a common way to frame the relationship, but the correlation tested here needs to be defined carefully.
We are not calculating a simple same-day correlation between the USD/JPY exchange-rate level and the Nikkei 225 price level.
Using FactDecode’s Factor-Target Correlation, we examine the relationship between USD/JPY lag pct change 1 and the Nikkei 225’s subsequent 5-trading-day forward return.
In other words, the question is not whether the two markets moved together today. It is whether a one-day move in USD/JPY was associated with how the Nikkei 225 performed afterward.
USD/JPY’s 1-Day Change Showed a Positive Correlation With 5-Day Forward Returns
Factor-Target Correlation shows a positive correlation between USD/JPY lag pct change 1 and the Nikkei 225’s 5-trading-day forward return.
A higher USD/JPY change corresponds to a weaker yen. The positive correlation therefore points in the direction of larger yen-weakening moves being associated with stronger subsequent Nikkei 225 returns, while yen-strengthening moves are associated with weaker subsequent returns.
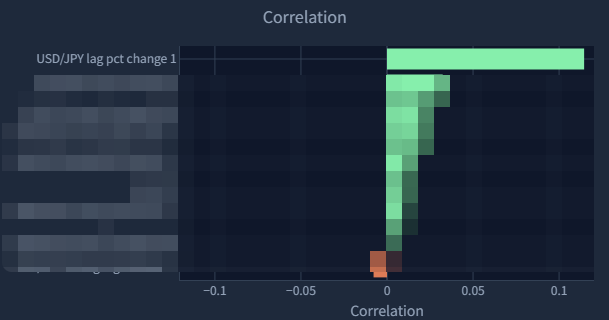
Other factors are obscured in the figure because the purpose here is not to present a factor ranking. The focus is specifically on USD/JPY lag pct change 1 and its relationship with subsequent Nikkei 225 performance.
Correlation, however, is not causation. A positive correlation also does not mean this factor can be turned directly into a reliable trading rule.
To make the relationship easier to interpret, we next divide USD/JPY’s 1-day changes into quantiles and examine what happened to the Nikkei 225 afterward.
The Next Five Trading Days Looked Different After Yen-Strengthening and Yen-Weakening Moves
When USD/JPY lag pct change 1 is divided into ten quantiles, the difference in subsequent Nikkei 225 performance becomes relatively clear.
In Q1, which contains the largest yen-strengthening moves, USD/JPY’s 1-day change ranged from −3.70% to −0.71%. The Nikkei 225’s average 5-trading-day forward return was −0.67%, and the share of observations with a positive return was 44.7%.
At the other end, Q10 contains the largest yen-weakening moves, with USD/JPY changes from +0.69% to +5.35%. The average subsequent Nikkei 225 return was +0.87%, while the share of positive returns rose to 64.4%.

The relationship is not perfectly monotonic across all ten quantiles. For example, the average return in Q4 was +0.29%, compared with +0.05% in Q5.
Even so, the broader pattern is visible. Q1 through Q3, representing the stronger-yen side of the distribution, all produced negative average forward returns. Moving toward larger yen-weakening changes, positive average returns become more prominent.
The result is also not driven only by the most extreme Q10 bucket. Q9 produced an average forward return of +0.57%, with positive returns in 61.4% of observations, while Q10 reached +0.87% and 64.4%, respectively.
This does not prove a mechanical rule that “weaker yen equals higher stocks.” But in this dataset, the direction and magnitude of USD/JPY’s one-day move show a relatively clear relationship with Nikkei 225 performance over the following five trading days.
Watching USD/JPY After Tokyo Closes Fits a Familiar Trading Intuition
For traders in Japanese equities, continuing to watch USD/JPY after the Tokyo market closes is familiar behavior. If the currency moves sharply overnight in response to U.S. interest rates, economic data, monetary-policy expectations, or changes in risk sentiment, it is natural to wonder how Japanese equities might trade the next day.
The relatively clear relationship between USD/JPY lag pct change 1 and subsequent Nikkei 225 performance is consistent with that market intuition.
But this is interpretation, not quantitative evidence. The analysis does not prove that a trading intuition is correct simply because market participants monitor USD/JPY after the close.
What the data shows and how a trader interprets that result need to remain separate.
But This Does Not Mean USD/JPY Can Predict the Nikkei 225
There is one critical limitation to this analysis:
the Nikkei 225 and USD/JPY do not have the same daily closing time.
The Nikkei 225 and USD/JPY Do Not Share the Same Daily Close
The Nikkei 225’s daily close is determined when the JPX cash market closes. The foreign-exchange market, however, continues trading after the Tokyo equity market has closed.
FactDecode currently aligns these daily market series by date. In this analysis, it does not align them by the exact time at which each market’s daily value became available.
As a result, observations carrying the same calendar date do not necessarily represent information that was available at the same moment. The Nikkei 225 value reflects the Tokyo market close, while the USD/JPY daily value may include currency moves that occurred afterward. This timing difference is a required caveat in the Research Handoff.
This is particularly important when interpreting USD/JPY lag pct change 1.
The result therefore should not be read as:
“If I check USD/JPY at the JPX close, I can predict where the Nikkei 225 will be five trading days later.”
The same-date USD/JPY observation may contain information generated after the Japanese equity market had already closed.
This analysis is therefore not a test of a pure predictive signal that was fully available at the JPX close.
Even So, the Daily Relationship Between USD/JPY and the Nikkei 225 Is Hard to Ignore
The difference in daily closing times does not make the analysis meaningless.
The foreign-exchange market continues processing new information after Tokyo equities close. Economic data, interest rates, monetary-policy expectations, and shifts in investor risk appetite can all move USD/JPY during those hours.
If some of that information is subsequently reflected in Japanese equities, it would not be surprising for a relationship to appear between daily USD/JPY movements and later Nikkei 225 performance.
The appropriate interpretation is therefore not a pure lead-lag trading signal available at the JPX close. It is better understood as a daily cross-market relationship between a currency market that continues trading outside Tokyo equity hours and subsequent Japanese stock performance.
That relationship also remains visible after adding factors describing the Nikkei 225’s own longer-term market state.
So the answer to “Are USD/JPY and the Nikkei 225 related?” is not simply yes or no.
The daily data shows a relatively clear relationship, but that relationship should not be treated as either a causal result or a directly tradable predictive signal.
Conclusion: USD/JPY’s 1-Day Move Is Related to Subsequent Nikkei 225 Returns—but It Is Not a Simple Trading Rule
We examined the relationship between USD/JPY lag pct change 1 and the Nikkei 225’s subsequent 5-trading-day forward return.
Factor-Target Correlation showed a positive relationship. The quantile results also showed weaker subsequent Nikkei 225 performance following larger yen-strengthening moves and stronger performance following larger yen-weakening moves.
In the most yen-strengthening Q1 bucket, the average subsequent 5-trading-day return was −0.67%, with positive returns in 44.7% of observations. In the most yen-weakening Q10 bucket, the average return was +0.87%, with positive returns in 64.4% of observations.
The contribution associated with USD/JPY lag pct change 1 also remained after adding factors describing the Nikkei 225’s longer-term trend and position relative to recent highs and lows. That makes it harder to explain the relationship purely as a reflection of an already strong or weak Nikkei 225.
But this is not evidence that a stronger yen always means Japanese stocks will fall, or that a weaker yen always means they will rise. The quantile pattern is not perfectly monotonic, and neither correlation nor Factor Importance / Contribution establishes causation.
Most importantly, the Nikkei 225 and USD/JPY do not share the same daily closing time. The result cannot be treated as a predictive signal that was necessarily available at the JPX close.
What the historical data does show is narrower:
USD/JPY’s most recent one-day direction and magnitude have a relatively clear relationship with how the Nikkei 225 performed over the following five trading days.
That is the extent of the conclusion supported by this analysis.